SCPI Commander


SCPI Commander - This app will connect to any LXI enabled instrument. You can control and get data back using for example SCPI (Standard Commands for Programmable Instruments) or any other kind of commands that can be send as plain ASCIII over socket.
Also included is a script engine to automate control and measurement, doing math and statistical calculations etc.
Features
* Connected instrument can be added as favorite to make connection easier next time.
* Automatically enquires the identity of the connected instrument.
* Favorites can be exported as a CSV file.
* Interactive IO, send and see the results immediately
* Logging off a number of measurement.
* Easy export off the session from both interactive io and logging measurement .
* Ability to change the time-out value
* Ability to change how much data can be read back.
* Quick access to the instrument web-page
* Quick access to common SCPI commands.
* During logging, possible to pause and step through measurements.
* Extensive help for interactive IO and logging measurement
Script Engine features
* Connect to several instruments
* Loop
* Variables
* If then
* Go to
* Get info from user
* Display information
* On error catch
* Execution speed
* Math calculations
* Statistical calculation
* Export data as binary or CSV
* Export pictures
* Bit commands
NOTE!
Version 2.7 is now available on the App Store:
New reserved variables:
Version - Retuns the SCPI-Commander version.
BuildNrNR - Returns the SCPI-Commander build number.
TimeStamp - Returns the number of seconds since jan 1 2001 00:00:00.
Speed - Returns the current speed in ms.
Bug fixes:
Logging - Sometimes when live plotting starts an empty row was added to the session history is now fixed.
All math and comparison is now done using double instead of float to increase the accuracy and range.
New Demoscripts:
Plot Waveform Infiniivision Bin Xaxis.txt - Show how to scale the x-axis
Timestamp.txt - Shows how to use the timestamp to calculate the time.
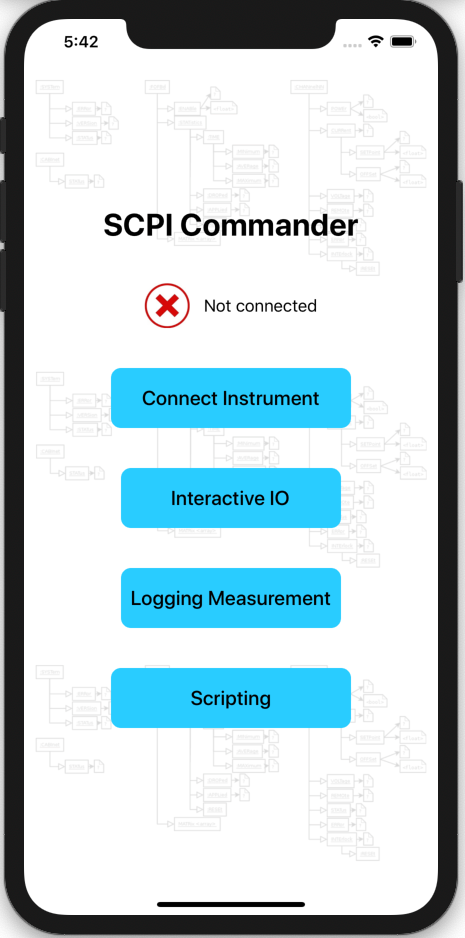
Main View
"Not Connected" shows that no instrument is connected
Connect Instrument - Tapp this button to connect to an instrument
Interactive IO - Tapp this button to stat sending commands
Logging Measurements - Tapp this to start logging measurements.
Scripting - Edit and run script to control instruments
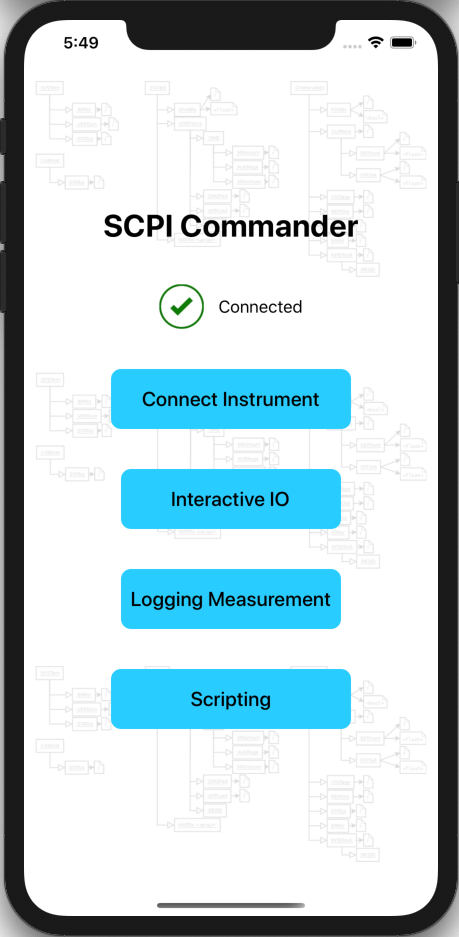
The main view when we are connected to an instrument.
Main View
"Not Connected" shows that no instrument is connected
Connect Instrument - Tapp this button to connect to an instrument
Interactive IO - Tapp this button to stat sending commands
Logging Measurements - Tapp this to start logging measurements.
Scripting - Edit and run script to control instruments
Connect View
Done - Closes the view and goes back to main.
? - Open the help.
Boxes - Change the buffer size. Default is 4096, This is the maximum number of bytes that can be read back from the instrument.
Print - Print the favorites to an Air Print enabled printer.
Action - Let you export the favorites as a csv file.
Instrument Address - Type in the address to the instrument.
Port - The port to use, default for LXI is 5025
Disconnect / Connect - This button disconnects or connects to the instrument.
Default Port - Slide this button to use another port than default 5025
Identity - The instrument identity. *idn command is sent.
*idn? - Send the *idn? Command. If the instrument failed to during connect you can use this to ask again.
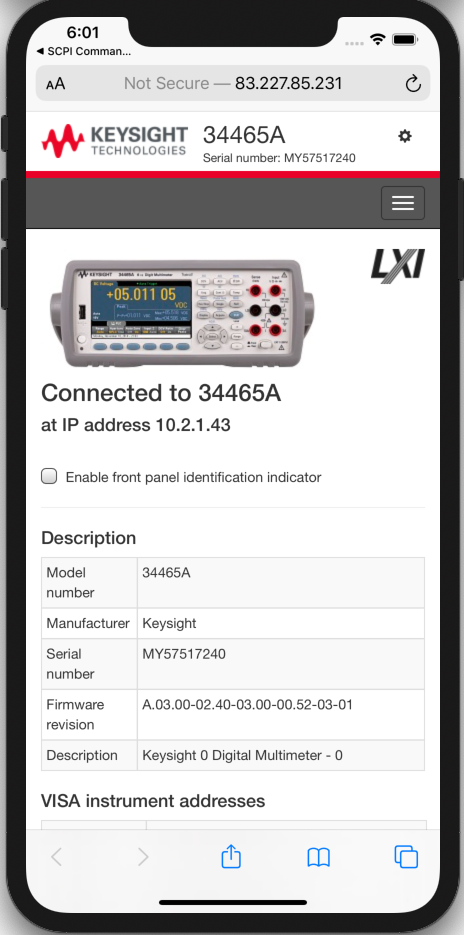
Globe - Open the instrument web-page.
Add to favorites - Add the instrument to favorites.
Import favorites - Imports a previously saved favorites files (used the action button)
Slide a favorite to the left to edit or delete.
Example of an instruments web-page

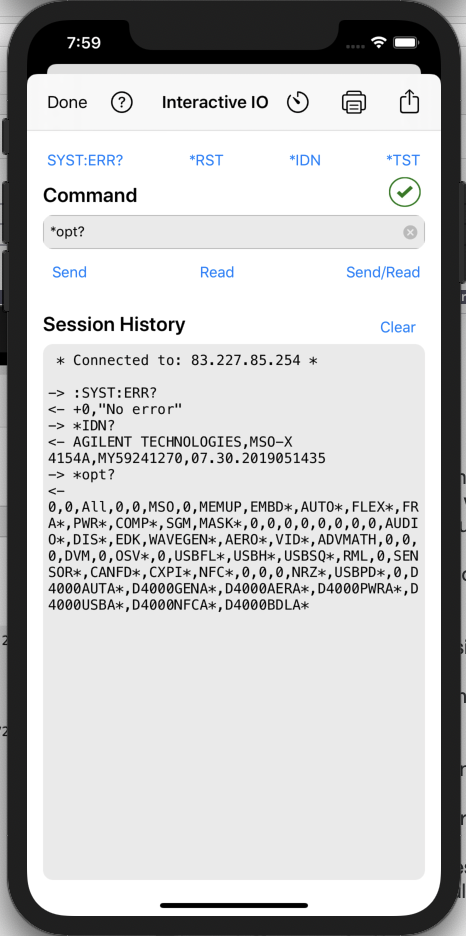
Interactive IO View
Done - Exit the view
? - Open the help.
Stopwatch - Change the timeout. The maximum time the app will wait for a response from the instrument.
Printer - Print the session history to an Air Print enabled printer.
Action - Share the session as a text file.
SYST:ERR? - Ask the instrument for the last error.
*RST - Reset the instrument
*IDN? - Ask for the instruments identity
*TST - Perform a self test on the instrument. 0 indicates a successful test.
Command - The command to send to the instrument, Several command can be typed by using semicolon as separator.
Send - Send the command to the instrument
Read - Read back the response from the instrument.
Send/Read - Send and then read back the response.
Clear - Clear the session
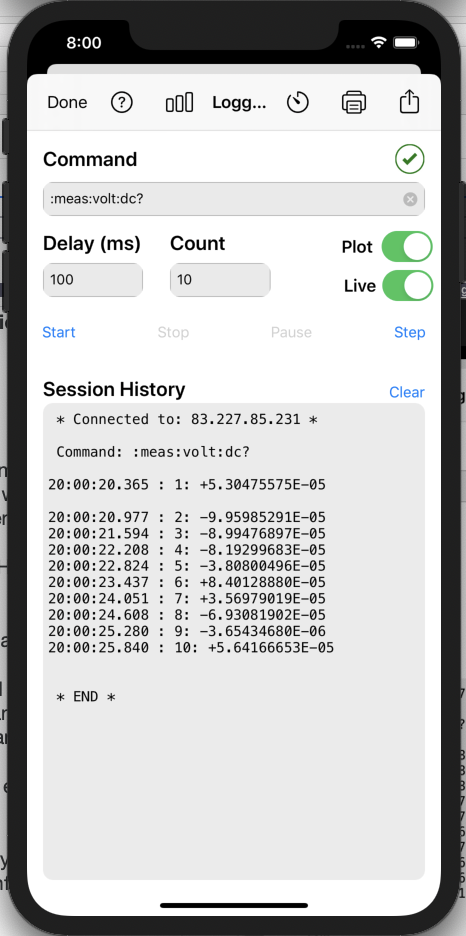
Logging Measurements View
Done - Exit the view
? - Open the help.
Stopwatch - Change the timeout. The maximum time the app will wait for a response from the instrument.
Printer - Print the Session History to an Air Print enabled printer.
Action - Share the session as a text file.
Command - The command to send to the instrument, Several command can be typed by using semicolon as separator.
Delay - The delay between each command sent.
Count - How many measurements should be done. 0 means infinity, logging until Stop is tapped.
Plot - When enabled a plot of the measured values is displayed at the end
Live - When enabled a plot will be shown and updated live. Plot also need to be enabled.
Start - Start the logging
Stop - Stop the logging
Pause - Pause the logging
Step - Do one measurement, must be stopped or paused.
Clear - Clear the session
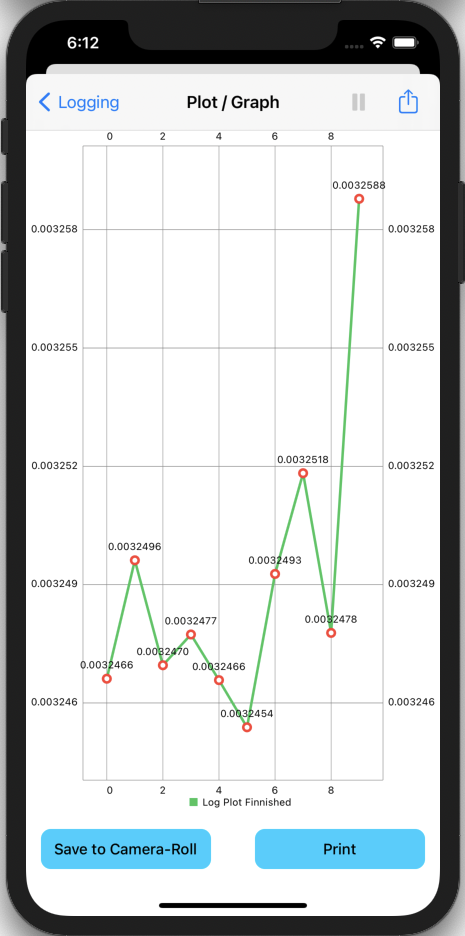
Example of the Live Plot / Plot
You can pause the logging by pressing the || button
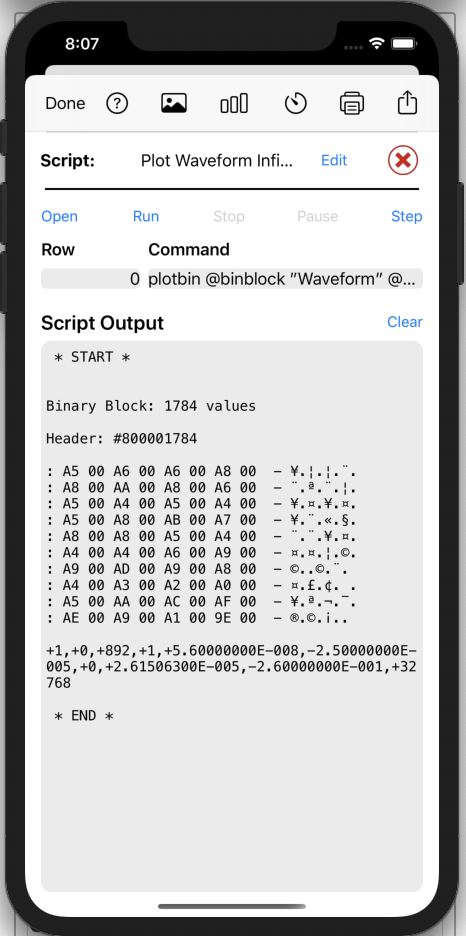
Script View
Done - Exit the view
? - Open the help.
Picture - View the last picture got from an instrument
Graph - View the last plot/graph
Stopwatch - Change the timeout and speed. The maximum time the app will wait for a response from the instrument. Speed is the amount of ms between each command.
Printer - Print the session history to an Air Print enabled printer.
Action - Share the session as a text file.
Script - The name of the current script
Edit - Open the scrip editor to edit a script
Open - Open a script (using iOS Files)
Run - Run the current script
Stop - Stop the running script
Pause - Pause the script
Step - If paused the step and execute next row in the script.
Clear - Clear the session
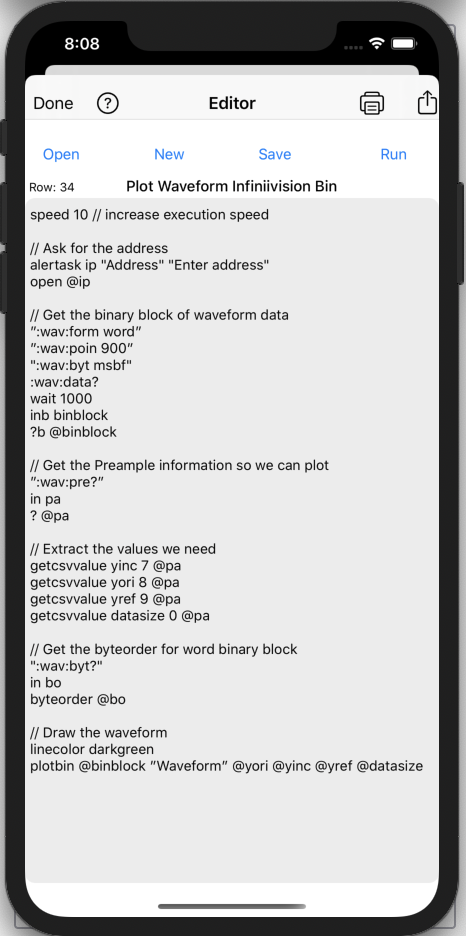
Script Editor
Done - Exit the view
? - Open the help.
Printer - Print the Session History to an Air Print enabled printer.
Action - Share the session as a text file.
Open - Open a script
New - Clear and start a new script
Save - Save the script
Run - Execute the script
Row - Show the row the marker is on.
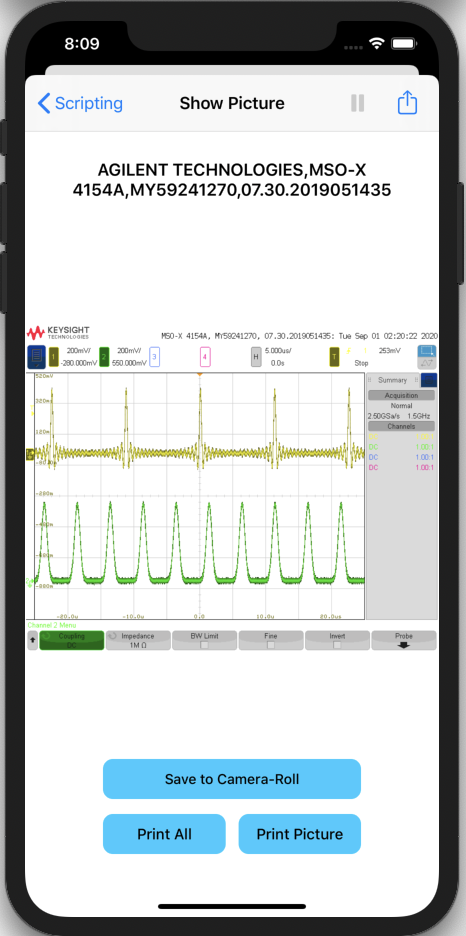
Picture Viewer
Scripting - Exit the view
|| - Pause the script (if running)
Action - Share the picture
Save to Camera-Roll - Save the picture to iOS Camera-Roll
Print All - Print the Instrument identity and picture
Print Picture - Print only the picture
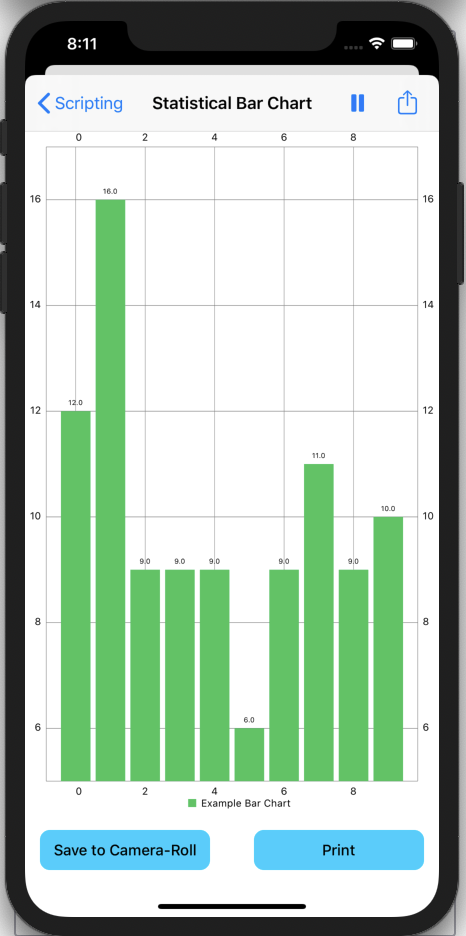
Plot/Graph Viewer
Shows a statistical Bar Char
Scripting - Exit the view
|| - Pause the script (if running)
Action - Share the graph as a an image etc.
Save to Camera-Roll - Save the graph as a image to the camera-roll
Print - Print the graph
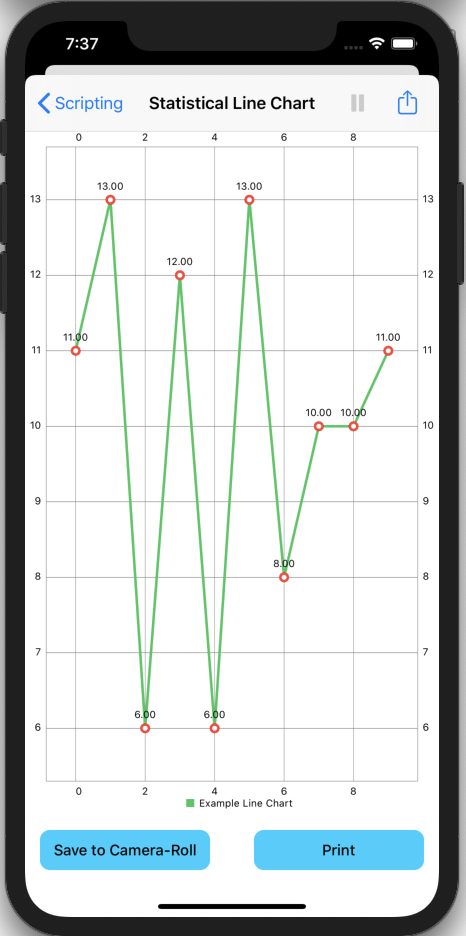
Plot/Graph Viewer
Shows a statistical Line Char
Scripting - Exit the view
|| - Pause the script (if running)
Action - Share graph the as a an image etc.
Save to Camera-Roll - Save the graph as a image to the camera-roll
Print - Print the graph
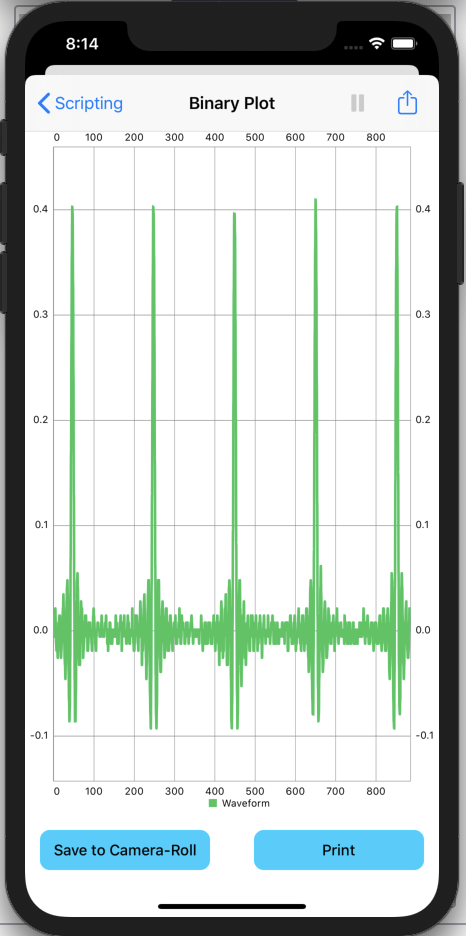
Plot/Graph Viewer
Shows a Binary Plot
Scripting - Exit the view
|| - Pause the script (if running)
Action - Share the plot as a an image etc.
Save to Camera-Roll - Save the plot as a image to the camera-roll
Print - Print the plot
Below are some short videos showing how SCPI Commander works